Update or change data in an existing graph
-
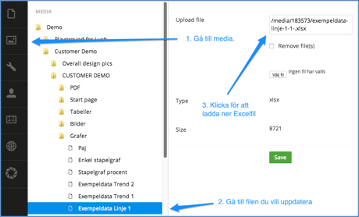
Go to the media library.
-
Click on that link to download the Excel file.
-
Navigate to the file you want to update (ie the Excel file associated with your graph). You expand a folder by clicking on the blue triangle next to the folder. Select the file folder to be updated.
-
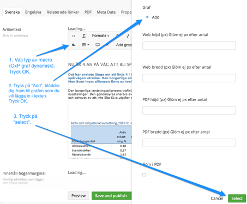
Enter new numbers and possibly new text in the excel file, save the file in a place where you know you can find it.
-
Go back to the media library, make sure you are in the correct folder
-
Click "choose file", locate the file you just updated,
-
Save.
Now you can go to the preview and update. The graph should now be updated with your new data.
Resize existing graph
To resize the graph:
-
Go into content, find the page where the graph is embedded in the text.
-
Click once on the graph to be modified. (The graph is a box marked with a yellow frame and with the text Graph image.)
-
Then click the macro button.

-
In the box that appears, you can enter the desired pixel sizes for the graph.
-
When you are happy with the change, press "Save and preview" to preview. If it looks good, you can press "Save and publish".
Place two graphs next to each other
-
Insert a graph table in content (with the insert graph table button

-
Insert a graph macro into each cell of the table.
-
Right-click on the table, reduce the width and height of the table to zero.
-
Save and publish. The two graph images thus appear parallel to each other.
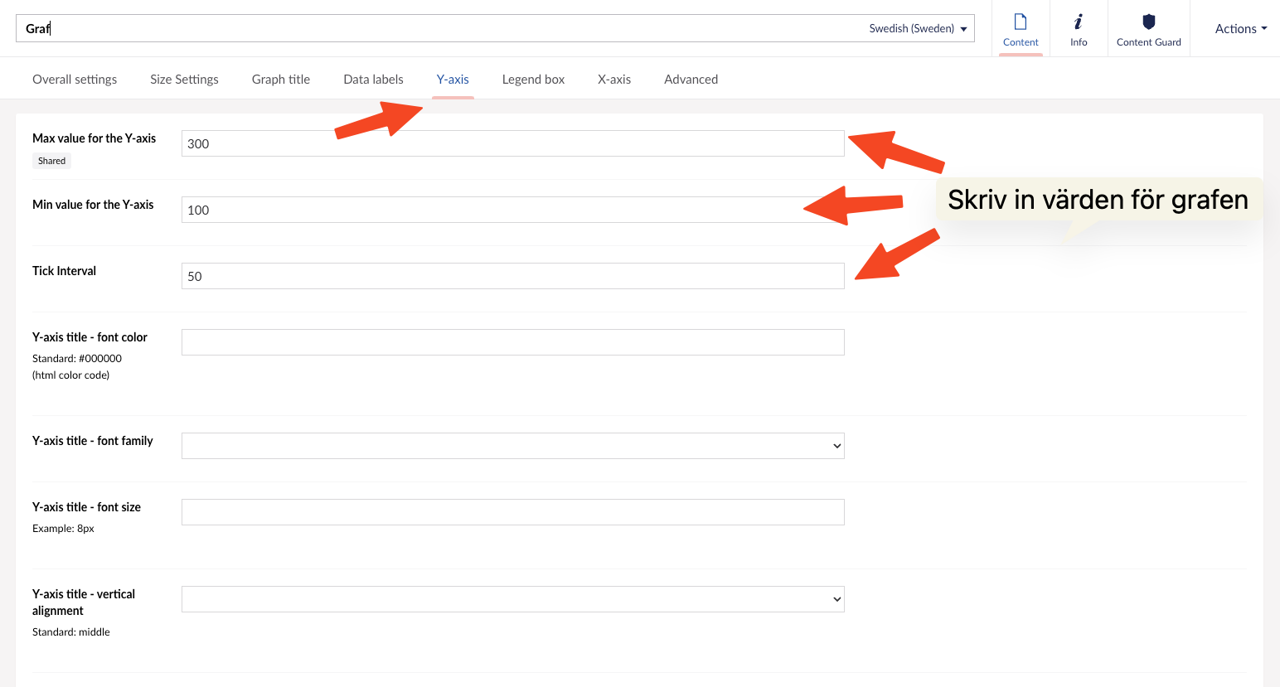
Change max/minimum value and tick interval on graphs
- Go to the graph to be modified.
- Click on Y-axis
- Enter values for the graph.