Creating a graph from scratch
...is done in three steps:
-
Make an Excel file with the basic data and upload it to the media library.
-
Add a graph node and link in content
-
Correct settings
Make an excel file with graph data
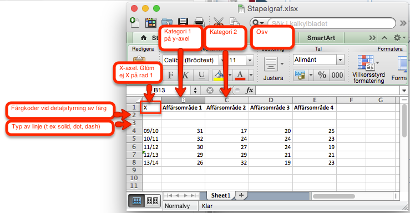
Excel file that is to be the basis for a graph with axes (bar graph with one or two axes, line graph or area graph) must have the following format:
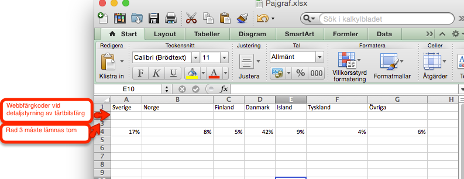
The Excel file that is to be the basis for a pie chart must have the following format
-
Category name on line 1
-
Always leave lines 2 and 3 empty (if you don't want to fine-tune a cake piece color, then enter a web color code in line 2)
-
Data in line 4
-
Chart colors are normally controlled centrally on the web page. If you want to control the color of a certain bar, line or pie chart in detail, you can use line 2 in the Excel document to control the color of the data segment (eg the pie pie or the bar in the chart) in detail, if this is to deviate from the standard color. The color is specified in the html color code, e.g. #000000.
Line 3 of the excel document for graphs with axes is used to control the format of any lines. Values that can be entered here:
-
Solid
-
Dot
-
Dash